Latvia: basic indexes of the economic development
2002 | 2003 | 2004 | 2005 | 2006 p | |
(growth to the previous year, percentage) | |||||
| Gross domestic product | 6,5 | 7,2 | 8,6 | 10,2 | 11,0 |
| – Private consumption | 7,4 | 8,2 | 9,5 | 11,4 | 11,0 |
| – National consumption | 2,2 | 1,9 | 2,1 | 2,7 | 3,0 |
| – Equity capital total | 13,0 | 12,3 | 23,8 | 18,6 | 18,0 |
| – Export | 5,4 | 5,2 | 9,4 | 20,7 | 7,6 |
| – Import | 4,7 | 13,1 | 16,6 | 13,5 | 8,4 |
| Consumer prices | 1,9 | 2,9 | 6,2 | 6,7 | 6,5 |
(percentage to gross domestic product, if not indicated differently) | |||||
| Fiscal balance of combined budget | -2,3 | -1,6 | -1,1 | -1,2 | -1,5 |
| Public debt | 13,1 | 13,2 | 13,2 | 10,7 | 10,5 |
| Current account of the balance of payments | -6,6 | -8,1 | -12,9 | -12,4 | -12,5 |
| Foreign direct investments received within a year | 2,8 | 2,6 | 5,1 | 4,0 | 6,0 |
| Unemployment rate (specific weight of people looking for a job % of economically active inhabitants, 15-74 years of age) | 12,0 | 10,6 | 10,4 | 8,7 | 8,0 |
GDP dynamics in Latvia and EU
(2000.y. = 100%)
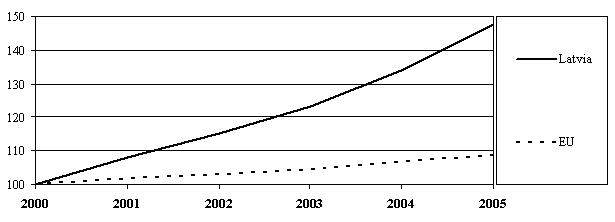 Source: Eurostat
Investment increment rate in EU member states 2000 – 2005
(Annual average, percentage)
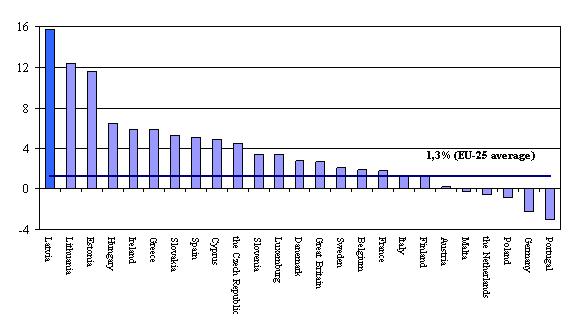 Source: Eurostat, Annual Macroeconomic data base, ec.europa.eu/economy_finance
Investments in manufacturing industry*
(2000=100)
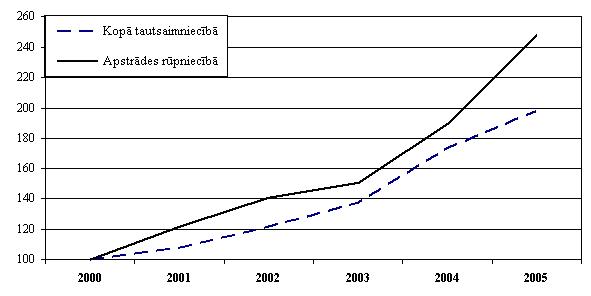 • According to non-financial investment statistics
Investment dynamics and structure of manufacturing industry
(%)
| Increment rate | Structure | |||||
| Average 2001-2005 | 2005* | 2006*.y. 1.quarter | Average 2001-2005 | 2005* | 2006*.y. 1.quarter | |
| Food industry | 18,3 | 22,1 | 17,1 | 28,7 | 20,0 | 27,4 |
| Light industry | -11,0 | -40,3 | 22,2 | 6,8 | 3,7 | 7,5 |
| Woodworking | 20,8 | 77,0 | 58,6 | 28,4 | 42,0 | 18,2 |
| Paper manufacture and publishing | 2,7 | -16,9 | 24,1 | 6,9 | 4,3 | 11,3 |
| Chemical industry and the related industries | 20,7 | -14,8 | 35,5 | 6,2 | 2,8 | 8,6 |
| Manufacture of other non- metallic mineral articles | 62,8 | 146,0 | 71,1 | 5,2 | 10,1 | 3,4 |
| Metals and metalworking | 40,7 | 83,3 | -8,5 | 6,7 | 9,0 | 8,6 |
| Machine and equipment manufacture | 33,8 | 83,1 | -17,4 | 6,8 | 5,1 | 7,2 |
| Other industries | 21,7 | -14,6 | -38,8 | 4,2 | 3,0 | 7,8 |
* estimated according to the quarterly data
Area of the territories of statistical regions of Latvia, number of inhabitants and
density of population in the beginning of the year 2006
| Area (% of national territory) | Number of inhabitants (% of total) | Number of inhabitants per 1 km2 | |
| Riga | 0,5 | 31,7 | 2 368,4 |
| Riga area | 15,7 | 16,1 | 36,4 |
| Vidzeme | 23,6 | 10,6 | 15,9 |
| Kurzeme | 21,1 | 13,4 | 22,7 |
| Zemgale | 16,6 | 12,5 | 26,7 |
| Latgale | 22,5 | 15,7 | 24,7 |
Gross domestic product* in statistical regions in 2003
| Territory | GDP, actual prices | GDP per 1 person | ||
| total, thousands of lats | % of total amount | lats | %, to normal value in the | |
| Latvia | 6 392 778 | 100 | 2 749 | 100 |
| int.al.: | ||||
| Riga | 3 589 535 | 56,1 | 4 869 | 177 |
| Riga area | 645 362 | 10,1 | 1 786 | 65 |
| Vidzeme | 410 760 | 6,4 | 1 646 | 60 |
| Kurzeme | 758 429 | 11,9 | 2 412 | 88 |
| Zemgale | 457 537 | 7,2 | 1 574 | 57 |
| Latgale | 527 489 | 8,3 | 1 418 | 52 |
| Produced outside Latvia | 3 667 | 0,1 | x | x |
* Total value added (KPV) and gross domestic product (GDP) data of the year 2003 calculated according to the requirements of European Commission Regulation No 1889/2002 regarding the implicitly estimated services of financial mediation (FISIM), not comparable to the data published in previous reports.
Specific weight of the most significant industries in total value added * in 2003
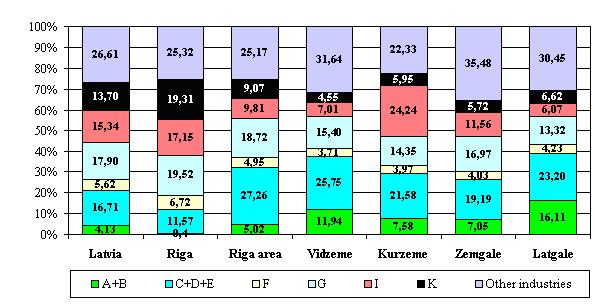 A+B – agriculture, forestry and fishery; C+D+E – industry; F – construction;
 G – trade; I – transport and communications; K – commercial services.
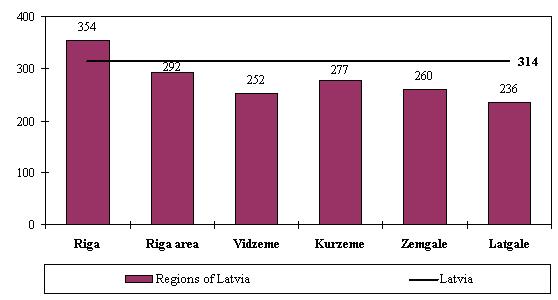
Employee gross wage in 2004
(Euro)
Information source – “Report on the development of national economy of Latvia”, published by the Ministry of Economics of the Republic of Latvia in 2006.